Fundamentals of High-Performance Liquid Chromatography
High-performance liquid chromatography (HPLC) is an analytical separation technique in which a liquid sample is forced through a column packed with a stationary phase under high pressure. The individual components of the sample interact differently with the stationary phase based on their physicochemical properties, resulting in differential retention times and separation of the mixture into its constituent species. A detector positioned at the column outlet records the eluting analytes as a function of time, producing a chromatogram.
HPLC has been the gold-standard analytical technique for peptide characterization since the 1970s. Its ability to resolve closely related peptide species, including full-length target peptides from deletion sequences differing by a single amino acid residue, makes it an indispensable tool in peptide quality control. Modern HPLC systems achieve theoretical plate counts exceeding 100,000, providing the resolving power necessary to detect and quantify minor impurities at levels below 0.1% of the total sample.
The key components of an HPLC system include: a solvent delivery system (pump) capable of generating precise flow rates at high pressures (typically 100-400 bar for conventional HPLC, up to 1000+ bar for UHPLC), an injector for introducing the sample onto the column, the analytical column containing the stationary phase, a detector (most commonly UV/Vis for peptides), and a data system for recording and processing the chromatographic data. The selection and optimization of each component directly influence the quality of the analytical results obtained.
Reversed-Phase HPLC: The Standard for Peptide Analysis
Reversed-phase HPLC (RP-HPLC) is the most widely used chromatographic mode for peptide separation and purity analysis. In RP-HPLC, the stationary phase is hydrophobic (non-polar), while the mobile phase is a polar aqueous/organic mixture. Peptides interact with the hydrophobic stationary phase through hydrophobic interactions involving their non-polar side chains and backbone regions. More hydrophobic peptides are retained longer on the column and elute at higher concentrations of organic solvent.
The separation mechanism in RP-HPLC is primarily governed by the partitioning of analytes between the polar mobile phase and the non-polar stationary phase. Peptides adsorb to the hydrophobic surface at low organic solvent concentrations and desorb as the organic content of the mobile phase increases during gradient elution. The selectivity of the separation, meaning the ability to distinguish between closely related peptide species, depends on the specific interactions between the analyte, the stationary phase ligand, and the mobile phase composition.
Gradient elution is standard practice for peptide RP-HPLC. A typical gradient starts with a high proportion of aqueous solvent (e.g., 95% water with 0.1% TFA) and increases the organic component (e.g., acetonitrile with 0.1% TFA) linearly over 20-40 minutes. The gradient rate (percent organic change per minute) is optimized to balance resolution, analysis time, and peak shape. Shallow gradients (0.5-1% per minute) provide better resolution but longer run times, while steeper gradients are used for rapid screening.
Column Chemistry: C18 Stationary Phases
The C18 (octadecylsilane) column is the most commonly used stationary phase for peptide RP-HPLC. C18 columns consist of silica particles (typically 3-5 micrometers for analytical columns, 1.7-2 micrometers for UHPLC columns) that have been chemically modified by bonding octadecyl (18-carbon) alkyl chains to the surface silanol groups. The resulting hydrophobic surface provides strong retention for peptides and excellent selectivity for resolving closely related sequences.
Column dimensions for analytical peptide HPLC are typically 150 mm or 250 mm in length with 4.6 mm internal diameter, though shorter columns (50-100 mm) and narrower formats (2.1 mm ID) are increasingly used with UHPLC systems. Pore size is an important parameter: 100-120 angstrom pore columns are standard for peptides below approximately 5,000 Da, while 300 angstrom wide-pore columns are preferred for larger polypeptides and small proteins to ensure accessibility of the analyte to the internal pore surface.
Alternative stationary phases are available for specialized applications. C8 (octylsilane) columns offer reduced hydrophobicity and may provide better peak shapes for highly hydrophobic peptides. C4 (butylsilane) columns are used for large polypeptides and proteins. Phenyl-hexyl columns introduce pi-pi interaction selectivity, which can be advantageous for separating peptides containing aromatic residues. The choice of stationary phase is guided by the specific analytical challenge and the properties of the target peptide.
Column temperature is another parameter that affects peptide separations. Elevated temperatures (40-60 degrees Celsius) can improve peak shape, reduce analysis time, and enhance the separation of conformational isomers. Temperature also influences the secondary structure of peptides in solution, which can affect their chromatographic behavior. Consistent column temperature control is essential for method reproducibility.
Mobile Phase Composition and Ion-Pairing Agents
The mobile phase in peptide RP-HPLC consists of two components: an aqueous phase (solvent A) and an organic phase (solvent B). The most common mobile phase system uses water with 0.1% trifluoroacetic acid (TFA) as solvent A and acetonitrile with 0.1% TFA (or 0.08% TFA) as solvent B. TFA serves as both a pH modifier (maintaining the mobile phase at approximately pH 2, which protonates basic side chains and the N-terminus) and an ion-pairing agent that associates with positively charged groups on the peptide, increasing hydrophobicity and improving peak shape.
The ion-pairing effect of TFA is critical for achieving sharp, symmetric peaks in peptide chromatography. Without an ion-pairing agent, basic peptides often exhibit broad, tailing peaks due to mixed-mode interactions with residual silanols on the silica surface. TFA effectively suppresses these interactions by neutralizing both the peptide charges and the silanol charges. However, TFA absorbs UV light at wavelengths below 220 nm, which can increase the baseline absorbance and reduce sensitivity at 214 nm.
Alternative ion-pairing agents include formic acid (0.1%), which is preferred when HPLC is coupled with mass spectrometry (LC-MS) because TFA can suppress ionization in electrospray MS. Heptafluorobutyric acid (HFBA) provides stronger ion-pairing than TFA and is used for highly polar or basic peptides that are poorly retained under standard TFA conditions. The choice of ion-pairing agent represents a trade-off between chromatographic performance and compatibility with downstream detection methods.
Acetonitrile is preferred over methanol as the organic modifier for peptide HPLC because it produces lower viscosity mixtures with water (reducing system back pressure), provides better UV transparency at 214 nm, and generally gives sharper peaks and better selectivity for peptide separations. Methanol may be used as an alternative when different selectivity is desired or for specific solubility reasons, but acetonitrile remains the standard organic solvent in peptide analytical laboratories.
UV Detection at 214 nm: Principles and Practice
Ultraviolet (UV) absorbance detection is the primary detection method for peptide HPLC. The standard detection wavelength of 214 nm targets the pi-to-pi-star electronic transition of the peptide bond (amide chromophore), which exhibits an absorption maximum in the 210-220 nm region. Because every peptide contains peptide bonds, detection at 214 nm provides nearly universal sensitivity for peptide analytes, regardless of their specific amino acid composition.
The molar absorptivity of the peptide bond at 214 nm is approximately 1,100-1,200 M per cm per residue, meaning that longer peptides produce proportionally stronger signals. This relationship is advantageous for purity analysis because the UV response is roughly proportional to the mass of peptide material in each chromatographic peak, allowing area-percent calculations to approximate weight-percent purities.
A secondary detection wavelength of 280 nm is often recorded simultaneously using a diode-array detector (DAD or PDA). The 280 nm channel detects aromatic amino acid side chains: tryptophan (molar absorptivity approximately 5,500 M per cm), tyrosine (approximately 1,490 M per cm), and phenylalanine (weakly, approximately 1 M per cm). Comparison of the 214 nm and 280 nm chromatograms provides additional information about peak identity and can help confirm that the main peak contains the expected aromatic residues.
Detector linearity is an important consideration for accurate purity measurements. UV detectors follow the Beer-Lambert law over a limited concentration range, and overloading the detector (typically above 1-2 AU) can produce clipped or distorted peaks that compromise purity calculations. Analysts must ensure that sample concentrations are adjusted to keep the main peak within the linear range of the detector, typically targeting a maximum absorbance of 0.5-1.0 AU for the tallest peak.
Reading and Interpreting Chromatograms
A chromatogram is a plot of detector response (UV absorbance at 214 nm, typically in absorbance units or milliabsorbance units) versus time (in minutes). Each peak in the chromatogram corresponds to one or more chemical species eluting from the column at a specific retention time. The target peptide typically appears as the dominant peak in the chromatogram of a purified sample, with minor peaks representing impurities.
Key features to examine in a peptide chromatogram include: the retention time of the main peak (which should be consistent with the expected hydrophobicity of the target sequence), peak shape (symmetric, Gaussian-like peaks indicate good chromatographic behavior; tailing or fronting may indicate column degradation, sample overloading, or secondary interactions), baseline stability (a flat, noise-free baseline indicates clean solvents and proper gradient formation), and the presence and relative sizes of impurity peaks.
Common impurity peaks in peptide chromatograms include deletion sequences (eluting close to the main peak, typically slightly earlier or later depending on which residue is missing), oxidized species (methionine sulfoxide variants typically elute earlier than the parent peptide due to increased polarity), deamidation products (asparagine-to-aspartate conversion, which also alters retention time), and truncated sequences (shorter fragments that typically elute earlier due to reduced hydrophobicity).
Resolution (Rs) between adjacent peaks is the quantitative measure of separation quality. Baseline resolution (Rs greater than 1.5) is desired for accurate quantification of individual species. When peaks overlap, the accuracy of purity calculations is compromised because the integration software cannot accurately apportion the overlapping area between the two species. Method optimization, including adjustment of gradient slope, column temperature, or mobile phase composition, may be necessary to achieve adequate resolution for challenging separations.
Calculating Purity: Area Percent Method
Peptide purity by HPLC is calculated using the area normalization (area percent) method. The chromatographic data system integrates the area under each peak in the chromatogram, and the purity is expressed as the percentage of total integrated area attributable to the target peptide peak.
The formula is straightforward: Purity (%) = (Area of target peak / Total area of all peaks) multiplied by 100. For example, if the target peptide peak has an integrated area of 980,000 and the sum of all peak areas is 1,000,000, the purity is 98.0%. Integration parameters such as baseline placement, peak detection threshold, and area rejection limit must be consistently applied and documented to ensure reproducible purity calculations across different samples and laboratories.
Several factors can influence the accuracy of area-percent purity measurements. Baseline noise and drift can introduce integration artifacts, particularly for small impurity peaks. Co-eluting impurities (species with identical retention times to the target peptide) are not detected and are effectively counted as part of the target peak area, potentially leading to overestimation of purity. Conversely, impurities with no UV chromophore (such as inorganic salts or small organic fragments without amide bonds) are not detected and do not appear in the area-percent calculation.
For these reasons, HPLC purity should be considered as one component of a comprehensive analytical characterization that also includes mass spectrometry (to confirm molecular identity), amino acid analysis (to verify composition and determine net peptide content), and potentially other techniques such as capillary electrophoresis or ion chromatography for counter-ion determination. The combination of orthogonal analytical methods provides the most complete assessment of peptide quality for research applications.
Interpreting Certificates of Analysis for Research Peptides
A certificate of analysis (COA) is the primary documentation accompanying a research peptide that provides analytical evidence of the product's identity and quality. For researchers procuring peptides for in-vitro studies, the ability to critically evaluate a COA is essential for ensuring that the compound meets the requirements of their experimental protocols.
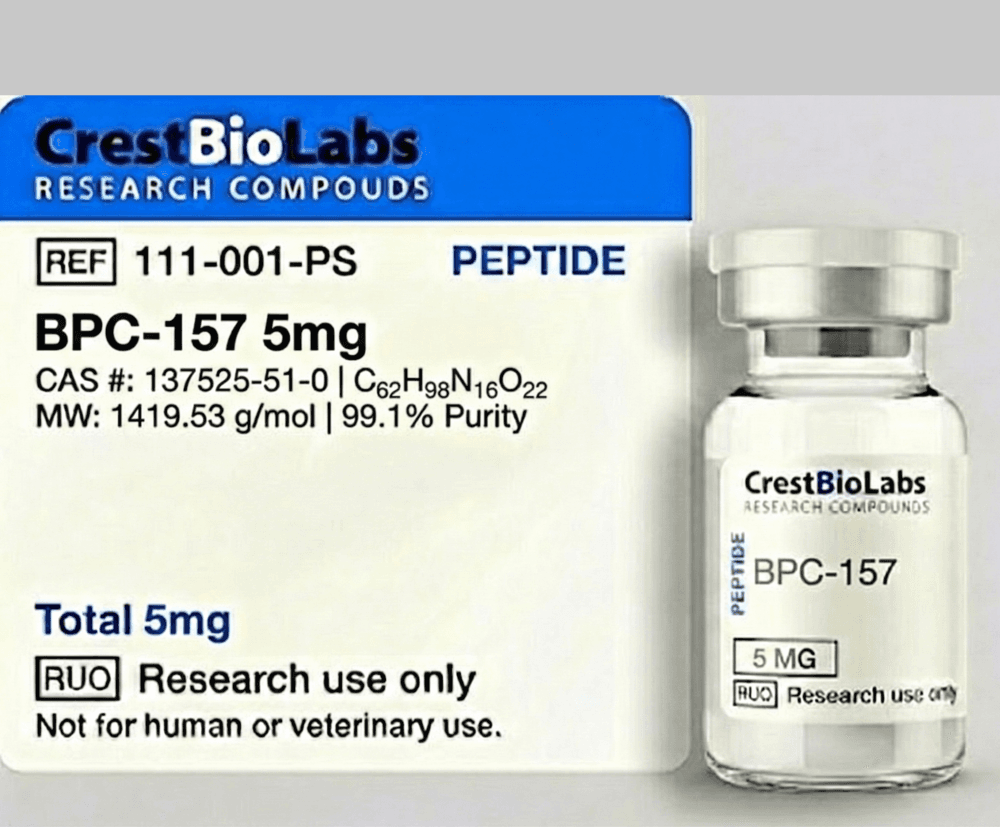
A well-documented COA should include the following elements: product identification (compound name, amino acid sequence, lot/batch number, CAS number where applicable), HPLC data (method description including column type, mobile phases, gradient conditions, temperature, flow rate, and detection wavelength; purity percentage; and preferably a representative chromatogram image), mass spectrometry data (expected and observed molecular weight, ionization method, and preferably the raw mass spectrum), physical appearance (description of the lyophilized powder), and net peptide content (the mass fraction of the total weight that is actual peptide, as opposed to counter-ions, residual moisture, and acetate/TFA salts).
When reviewing a COA, researchers should verify that the observed molecular weight from mass spectrometry matches the theoretical molecular weight calculated from the amino acid sequence, within the mass accuracy of the instrument (typically within 0.1% for ESI-MS or within 0.5 Da for MALDI-TOF). Discrepancies may indicate incorrect sequence, incomplete deprotection, chemical modifications, or adduct formation. The HPLC purity should meet or exceed the specification for the intended application, with the chromatogram showing a single dominant peak and minimal impurity peaks.
Net peptide content is a frequently overlooked but important parameter. Lyophilized peptides typically contain 60-80% peptide by weight, with the remainder consisting of counter-ions (TFA or acetate salts), residual moisture, and occasionally residual solvent. When calculating molar concentrations for in-vitro assays, researchers should use the net peptide content rather than the gross weight to ensure accurate preparation of stock solutions and working dilutions.